Étiquette : DataVizSociety
-

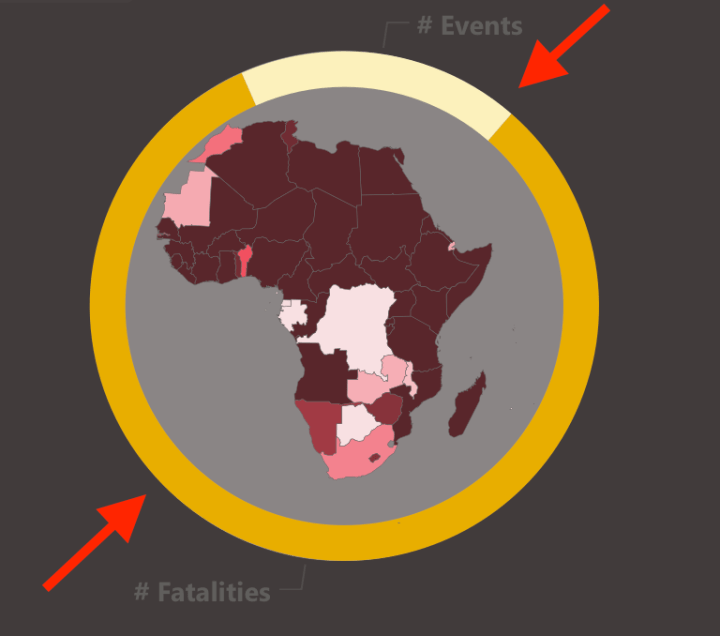
Tips & Tricks to Improve your Dashboard Design
Dashboard design elements There are five important elements to consider in the design phase for building great data visualizations. These elements should be incorporated while designing the dashboard and serve as a checklist once the dashboard design is complete. Using these elements help insist on high standards, especially when the target audience are business users.…
-
‘The Data Diaries’: Making Interactive Data Visualizations about World Banknotes
April marked the second anniversary of publishing the interactive data visualization project that changed my career trajectory. To commemorate the occasion (and launch “The Data Diaries” series), I wanted to share the story behind the visual essay “Who’s in Your Wallet?” and how it took me from being a podcast producer to working full-time as…
-
The evolution and future of interactive data visualization (Part 5)
The future of interactive data visualization, predictions from 2024 onward Interactive data visualization is an essential component in the current state of our web. But like everything else, it must evolve to keep pace with technological and societal progress. As our world becomes increasingly data-driven and technologies like AI, the Metaverse, and the decentralized web…
-
Flowers and Numbers
I’ve been wanting to dedicate more time to Data Art for a long time, but I’ve been thinking, planning, and preparing for a while without actually doing anything. It was clear to me that Data Art could be approached from several angles: it could provide more creative practice for data-minded people, while also offering insight…
-
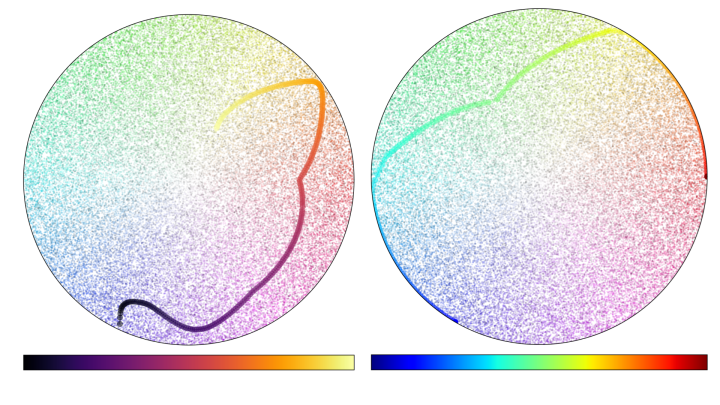
Color Jitter: Using Randomness to Augment Categorical Visualizations
Ode to my color map I love colormaps. The “Choosing Colormaps in Matplotlib” guide is practically my homepage. There’s a certain elegance to the act of taking a range of numbers, dividing that range into equal increments and assigning each increment a color. It’s quantitative and intuitive, yet leaves room for preference and personality. I…
-
The evolution and future of interactive data visualization (Part 4)
Web 3.0 — The start of the decentralized, user-owned and immersive web, approx. 2014–2024 The next step of digital reality By the year 2014, we realized we needed more than just sharing our opinions and content through the existing platforms as the intermediaries, so Web 3.0 and other initiatives like the Fediverse were born as a more decentralized internet.…
-
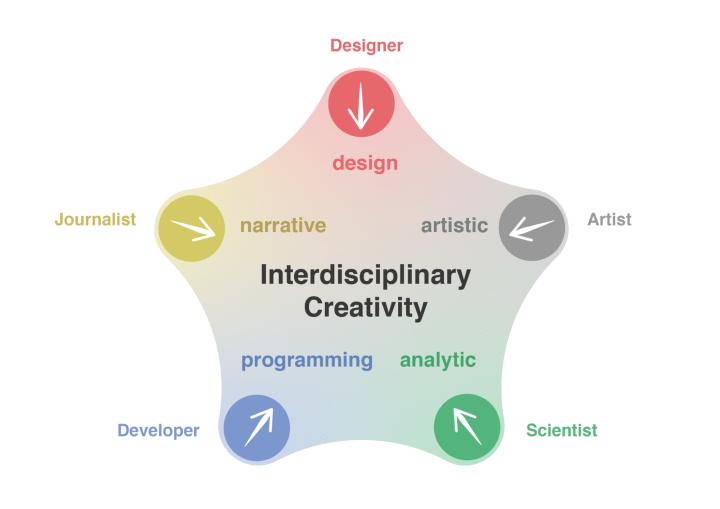
Visualization Through Interdisciplinary Creativity
The problem: collaboration without predetermined context The context of Complexity Science Hub (CSH) has afforded us the opportunity to ask difficult questions about the collaborative nature of visualization. CSH is an institution that operates within an international network of like-minded institutions, fostering a dynamic exchange of knowledge and talent. While data visualization often involves collaboration…
-

Navigating Data for Social Change: Lessons from the Abolitionists’ Database Project
In the mid-19th century, Angelina and Sarah Grimké, alongside Theodore Weld, embarked on a novel data-driven project to aid the fight of the U.S. abolition movement against slavery. By meticulously collecting and analyzing thousands of advertisements and articles from Southern newspapers, they created a comprehensive database that revealed the harsh realities of slavery. An innovative…
-
The Evolution and Future of Interactive Data Visualization (Part 3)
PART 3: Web 2.0 — The rise of user-generated content and interactivity, approx. 2004–2014 Interactive data visualization is an essential component in the current state of our web. But like everything else, it must evolve to keep pace with technological and societal progress. As our world becomes increasingly data-driven and technologies like AI, the Metaverse, and the…
-
From Analysis to Improvement: How Students Transform Projects
In my classes, I give students an assignment—find a dashboard from the dashboard gallery and write a review of it. The goal is to identify strengths and weaknesses, as well as to offer their ideas for improvement. And each time, students surpass themselves, presenting works worthy of mention in the article. Today’s story is special…